hearing frequencies
Due to their physical characteristics there is a limit to the frequency that we can hear. Conventionally, the human audible spectrum is set from 20Hz to 20KHz. The fact that we cannot hear does not mean that such sounds does not exist: sounds below 20Hz are named infrasound and sound above 20KHz are known as ultrasound. In fact, many animals communicate through sounds beyond human capabilities.
A very important fact about our ability of hearing different frequencies, is that the ear is not a linear transducer: even within the audible range, the ear is more sensible to specific frequencies mostly because of the resonance of the ear canal. This means that sounds that exercise the same pressure on the eardrum will be perceived with different loudness according to their frequency.
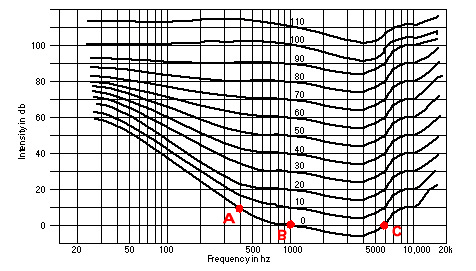
This study was first experimented by H. Fletcher and W.A. Munson in 1933, when they played a reference tone (1KHz) and a test tone of different frequencies and sound pressure levels to a sample of subjects: the subject were supposed to adjust the different test tones so that their loudness would be equal to the reference tone. It turned out that frequencies with the same SPL were perceived very differently in terms of loudness. From this experiment they drew what are now known as the Fletcher-Munson curves:

On the y axis we have pressure in dB(SPL), on the x axis the frequencies between 20Hz and 20KHz, and the numbers next to each curve are known as 'phons': the unit of measure of loudness that, unlike dB(SPL) takes into account the ear's response to frequencies and therefore gives a better idea of the perceived loudness of a sound.
Let's analyse the graph:
This graph shows us the value in dB(SPL) that each frequency must have for us to perceive it at the same loudness: if we take point B (1KHz) as a reference, we can see that at lower pressure levels, low frequencies must be 10 to 60 dB(SPL) louder for us to perceive them at he same level, and so (even if on a smaller scale) is for frequencies beyond 5KHz (C). It means that our ears are less sensitive to those frequency ranges. But there?s more: between B and C, the curves goes below the level of 1KHz, which indicates that we are more sensitive to frequencies between 2KHz and 4KHz more precisely. Those frequencies are the main frequency range of the human voice, so it is clear now that our ears act as a natural 'filter', that helps us to better understand the voices of other human beings and leave out unwanted noise. At higher pressure levels, the curves tend to be flatter, because, especially at low frequencies, our whole body vibrates and makes us hear more in the low range.
Basically we can read this graph as every frequency of a given amplitude along each of these curves sounds as loud as any other frequency on the same curve.
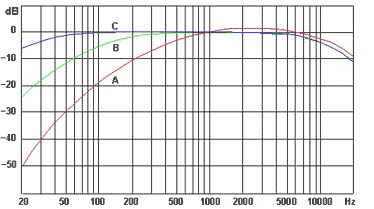
As you can see in the graph, the variation between the different frequencies perception varies with the sound pressure: high levels of pressure tend to linearize our ear's response. In order to have a unit of measure that takes into account the different responses of the ear at different phones (which cannot be considered a scale for loudness), a new system of weighting was developed. Currently, there are three weighting systems:
A-weighting: used to measure sounds in the range of 40dB(SPL)
B-weighting: used to measure sounds in the range of 70dB(SPL)
C-weighting: used to measure sounds in the range of 100dB(SPL)
The three systems were developed considering the different response of the ear to different level of pressure.

Curve A replicates human perception at low SPL values: there is a consistent roll-off at the low end and higher values in the more sensitive range. The A-weighting is commonly used in assessment of noise in work places and in potentially risky area. dB (B) and (C) are used for higher sound pressure levels.
In the next chapter we are going to see what happens to our hearing when exposed to different levels of sound pressure.
A very important fact about our ability of hearing different frequencies, is that the ear is not a linear transducer: even within the audible range, the ear is more sensible to specific frequencies mostly because of the resonance of the ear canal. This means that sounds that exercise the same pressure on the eardrum will be perceived with different loudness according to their frequency.
This study was first experimented by H. Fletcher and W.A. Munson in 1933, when they played a reference tone (1KHz) and a test tone of different frequencies and sound pressure levels to a sample of subjects: the subject were supposed to adjust the different test tones so that their loudness would be equal to the reference tone. It turned out that frequencies with the same SPL were perceived very differently in terms of loudness. From this experiment they drew what are now known as the Fletcher-Munson curves:

On the y axis we have pressure in dB(SPL), on the x axis the frequencies between 20Hz and 20KHz, and the numbers next to each curve are known as 'phons': the unit of measure of loudness that, unlike dB(SPL) takes into account the ear's response to frequencies and therefore gives a better idea of the perceived loudness of a sound.
Let's analyse the graph:
This graph shows us the value in dB(SPL) that each frequency must have for us to perceive it at the same loudness: if we take point B (1KHz) as a reference, we can see that at lower pressure levels, low frequencies must be 10 to 60 dB(SPL) louder for us to perceive them at he same level, and so (even if on a smaller scale) is for frequencies beyond 5KHz (C). It means that our ears are less sensitive to those frequency ranges. But there?s more: between B and C, the curves goes below the level of 1KHz, which indicates that we are more sensitive to frequencies between 2KHz and 4KHz more precisely. Those frequencies are the main frequency range of the human voice, so it is clear now that our ears act as a natural 'filter', that helps us to better understand the voices of other human beings and leave out unwanted noise. At higher pressure levels, the curves tend to be flatter, because, especially at low frequencies, our whole body vibrates and makes us hear more in the low range.
Basically we can read this graph as every frequency of a given amplitude along each of these curves sounds as loud as any other frequency on the same curve.
As you can see in the graph, the variation between the different frequencies perception varies with the sound pressure: high levels of pressure tend to linearize our ear's response. In order to have a unit of measure that takes into account the different responses of the ear at different phones (which cannot be considered a scale for loudness), a new system of weighting was developed. Currently, there are three weighting systems:
A-weighting: used to measure sounds in the range of 40dB(SPL)
B-weighting: used to measure sounds in the range of 70dB(SPL)
C-weighting: used to measure sounds in the range of 100dB(SPL)
The three systems were developed considering the different response of the ear to different level of pressure.

Curve A replicates human perception at low SPL values: there is a consistent roll-off at the low end and higher values in the more sensitive range. The A-weighting is commonly used in assessment of noise in work places and in potentially risky area. dB (B) and (C) are used for higher sound pressure levels.
In the next chapter we are going to see what happens to our hearing when exposed to different levels of sound pressure.
